Commercial TV and YouTube each reach about 2.6 million Finns aged 18–74 every week. Among under-37s only 17 % watch TV channels daily. Among over-55s it is 78 %. That is why TV and video work best together in Finland.
We went through seven waves of NØRR3 Media Insights from 2023–2026 and our own campaign studies. Below you will find the full picture, one myth and, as a bonus, an example campaign plan.
In short
- 69.6 % watch TV channels weekly, or 2.75 million people aged 18–74. In three years the figure has fallen by 6.8 pp, and almost all of the drop comes from under-56s.
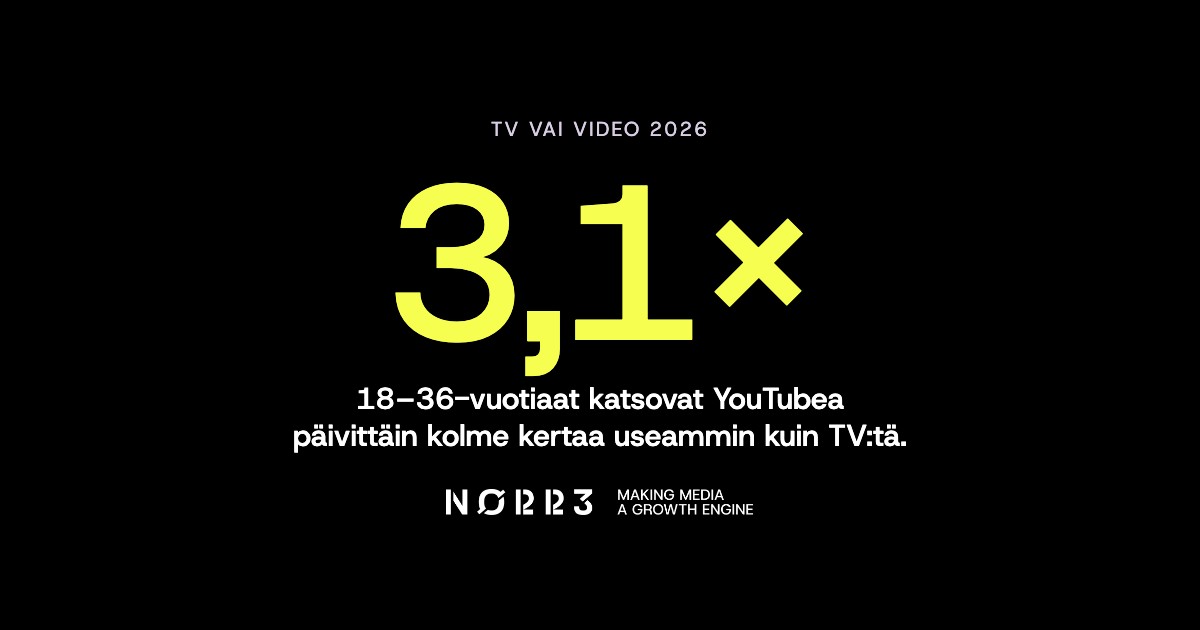
- YouTube is TV for the young. 18–36-year-olds watch it daily three times as often as TV channels. Among 56–74-year-olds it is the other way round.
- TV advertising gets people to act more often than streaming ads, 38.0 % vs 21.5 %, and it is the only media group that works equally well across all age groups.
- For a 150 000 euro campaign we would split the budget 60/40 in favour of TV. Estimated reach is 80 %, and the weight on TV brings recall.
How many viewers there are
| Media | % | People | Advertising possible |
|---|---|---|---|
| All TV channels, net | 69.6 % | 2.75 m | Yes, except Yle |
| Commercial TV channels (MTV, Sanoma, WBD etc.) | 65.1 % | 2.57 m | Yes |
| YouTube | 65.2 % | 2.58 m | Yes, 51.9 % open to ads |
| Yle Areena | 53.4 % | 2.11 m | No |
| Netflix | 38.7 % | 1.53 m | Not in Finland |
| MTV Katsomo | 36.9 % | 1.46 m | Yes |
| Ruutu | 28.2 % | 1.11 m | Yes |
| HBO Max | 21.3 % | 0.84 m | Yes |
| Ad-funded video in total, net | 84.3 % | 3.33 m | Yes |
On YouTube fewer people are open to advertising than watch, because some use an ad blocker or a paid Premium subscription. Of YouTube's 2.58 million viewers, advertising reaches about 2.05 million.
Source: NØRR3 Media Insights 08/2026 · Panel data Norstat · n = 2 022 · 95 % confidence interval ±1.6–2.2 pp
Finnpanel measures viewing with meters and shows the same direction. Viewing of TV channels fell by about half an hour a day, from 2 h 45 min (2018) to 2 h 16 min (2025). People still spend almost 3.5 hours a day in front of the TV screen. For under-45s, 70 % of viewing time is already streaming. Finnpanel's figures are higher than in our survey, because it counts anyone who has watched for at least one minute. Our research is based on which media respondents say they follow.
Source: Finnpanel, Television viewing in Finland 2025, TV year event 4.2.2026
What has changed in three years
| Age group | 09/2023 | 08/2026 | Change, pp |
|---|---|---|---|
| 18–36 | 60.3 % / 22.7 % | 46.5 % / 16.7 % | -13.8 / -6.0 |
| 37–55 | 75.1 % / 42.4 % | 69.2 % / 35.7 % | -5.9 / -6.7 |
| 56–74 | 92.7 % / 82.8 % | 91.5 % / 78.4 % | -1.2 / -4.4 |
| All 18–74 | 76.4 % / 50.1 % | 69.6 % / 44.1 % | -6.8 / -6.0 |
The biggest drop came among the young during 2025, and it has not come back. It is unlikely to. TV viewing among over-55s is practically unchanged.
The picture is more stable for video services. YouTube's weekly reach stayed at 56–60 % until 2025 and rose to 67 % in August 2026. A change in how we measure explains part of the rise, so we do not read it as pure growth. MTV Katsomo grew from 29.4 % to 36.9 % in a year (08/2025 vs 08/2026). Ruutu, Netflix and HBO Max have stayed level.
Source: NØRR3 Media Insights 09/2023–08/2026 · Panel data Norstat · age groups n = 468–727 per wave, ±1.9–4.5 pp
Three age groups, three different viewers
| 18–36 | 37–55 | 56–74 | All | |
|---|---|---|---|---|
| People | 1.24 m | 1.39 m | 1.33 m | 3.95 m |
| TV channels daily | 16.7 % | 35.7 % | 78.4 % | 44.1 % |
| Commercial TV weekly (index) | 42.6 % (65) | 64.9 % (100) | 86.3 % (132) | 65.1 % |
| YouTube daily | 52.6 % | 34.1 % | 19.4 % | 35.0 % |
| YouTube weekly (index) | 81.9 % (126) | 65.5 % (100) | 49.3 % (76) | 65.2 % |
| Katsomo / Ruutu weekly | 36.7 / 27.7 % | 34.8 / 28.7 % | 39.4 / 28.0 % | 36.9 / 28.2 % |
| HBO Max weekly (index) | 29.2 % (137) | 24.9 % (117) | 10.1 % (48) | 21.3 % |
| YouTube daily / TV daily | 3.1× | 1.0× | 0.25× | 0.8× |
Source: NØRR3 Media Insights 08/2026 · Panel data Norstat · n = 602 / 693 / 727 / 2 022 · 95 % confidence interval ±2.0–4.0 pp. Index 100 = average of 18–74-year-olds.
The survey does not ask directly which medium matters most. We use daily viewing as the measure, because it shows what is part of everyday life. Measured that way:
- For 18–36-year-olds, video is the main medium. 52.6 % watch YouTube daily, 16.7 % TV channels.
- Among 37–55-year-olds they are level. This is the group where a single-channel plan leaves the most people unreached.
- For 56–74-year-olds, TV is the main medium. Commercial TV reaches 86.3 % of them weekly, YouTube 49.3 %.
The broadcasters' own services, Katsomo and Ruutu, are the only ones where viewing does not depend on age. This is where TV content and video distribution meet.
Gender makes the biggest difference among the young. 34.0 % of women aged 18–36 watch commercial TV weekly (index 52), against 51.9 % of men. 93.3 % of men of the same age watch YouTube, against 70.3 % of women. Among over-55s there is no gender difference in TV, but women watch Katsomo more often than men (43.7 % vs 35.4 %).
Source: NØRR3 Media Insights 08/2026 · Panel data Norstat · age and gender groups n = 291–364, ±2.8–5.7 pp
Regional differences are smaller than age differences
| Major region | Commercial TV (daily) | YouTube | Katsomo | Ruutu |
|---|---|---|---|---|
| Helsinki-Uusimaa (n = 624) | 61.0 % (31.1 %) | 66.9 % | 34.6 % | 26.9 % |
| Western Finland (n = 515) | 67.0 % (34.1 %) | 64.8 % | 38.7 % | 31.9 % |
| Southern Finland (n = 420) | 65.7 % (34.5 %) | 63.9 % | 40.0 % | 29.0 % |
| Northern and Eastern Finland (n = 463) | 68.7 % (42.1 %) | 64.2 % | 35.6 % | 25.1 % |
| Whole country (n = 2 022) | 65.1 % (34.9 %) | 65.2 % | 36.9 % | 28.2 % |
YouTube is at the same level all over Finland. The difference for TV shows in daily viewing: in Northern and Eastern Finland 42.1 % watch commercial TV daily, in Uusimaa 31.1 %. Uusimaa is the only major region where YouTube reaches more people weekly than commercial TV. By province, TV viewing is highest in Kainuu, Satakunta and Lapland, but the samples are small, so treat these figures as indicative.
Source: NØRR3 Media Insights 08/2026 · Panel data Norstat · major regions ±3.5–4.7 pp
Evenings belong to both
On weekday evenings from 18 to 24, 68.9 % watch TV and 71.8 % watch streaming services. By age they mirror each other. Among 18–36-year-olds, 84.1 % stream in the evening and 52.0 % watch TV, and one in three (35.2 %) does not watch TV on weekdays at all. Among 56–74-year-olds, 84.9 % watch TV in the evening and 51.4 % stream.
Source: NØRR3 Media Insights 08/2026 · Panel data Norstat · n = 2 022 · ±2.0 pp (all), ±2.6–4.0 pp (age groups)
What advertising gets people to do
We asked what advertising in different channels had led respondents to do in the last three months.
| Channel | 18–36 | 37–55 | 56–74 | All | People |
|---|---|---|---|---|---|
| TV | 33.2 % | 40.3 % | 40.1 % | 38.0 % | 1.50 m |
| Streaming services | 29.9 % | 22.1 % | 13.0 % | 21.5 % | 0.85 m |
| Social media | 62.1 % | 56.0 % | 34.6 % | 50.7 % | 2.00 m |
| Influencers | 45.1 % | 30.4 % | 11.9 % | 28.8 % | 1.14 m |
"Acted" means the respondent searched for more information, visited a website or store, bought or recommended. Measured by purchases alone, TV (9.3 %) is level with social media (11.2 %) within the margin of error.
Three observations:
- TV is the only channel whose effect does not fall with age. Among over-55s the effect of social media falls to just over half, and that of influencers to a quarter, of the level among the young.
- Among 18–36-year-olds, streaming ads work as well as TV. They led to a purchase for 8.5 %, TV for 8.9 %.
- Men and women respond to TV advertising equally often (37.2 % vs 38.9 %). On social media and with influencers, women act clearly more often (59.0 % vs 42.5 % and 36.0 % vs 21.6 %).
These are respondents' own estimates, not measured sales. They still show where advertising stays in mind well enough for people to remember acting on it.
Source: NØRR3 Media Insights 08/2026 · Panel data Norstat · n = 2 022 (age groups 602–727) · ±0.9–2.2 pp (all), ±2.2–4.0 pp (age groups)
Recall: TV stays in mind best
In our own campaign studies, this is the median share who remembered the advertising after the campaign:
| Channel | Recall |
|---|---|
| TV | 31.0 % |
| Social media | 12.7 % |
| Broadcaster streaming (Katsomo, Ruutu) | 12.5 % |
| YouTube | 8.4 % |
Source: NØRR3 campaign bank, Norstat campaign studies 2023–2026, 37 studies in total. Recall also depends on the money spent in each channel, so the figure is not a direct ranking of channels.
PHD's data on 296 Finnish campaigns (2011–2021) gives the same order: TV 43 %, online video 13 %, social media 11 %. A video contact is cheaper than a TV contact, but it stays in mind less well. So video complements TV in reach and frequency. It does not replace it for recall.
Example: 150 000 €, 3 weeks, all 18–74-year-olds
The goal is reach and message recall. We modelled six splits. Total reach settles at about 80 % when TV's share is 50–65 %, so within that range recall decides. That is why we weight TV.
| Channel | Budget | Share | Reach, estimate |
|---|---|---|---|
| TV: MTV, Sanoma, WBD | 90 000 € | 60 % | about 40 % |
| YouTube | 35 000 € | 23 % | about 60 % |
| Katsomo and Ruutu | 25 000 € | 17 % | about 15 % |
| Total | 150 000 € | 100 % | about 80 % |
Reach by age group, estimate: 18–36-year-olds about 75 %, 37–55-year-olds about 80 %, 56–74-year-olds about 85 %.
For comparison, with the same money:
- TV only: reach about 60 %, but only about 35 % of 18–36-year-olds.
- Video only: reach about 70 %, even across age groups, but the weakest recall.
Within TV we would split the budget by reach: about half to MTV, a third to Sanoma and the rest to WBD. The main weight is on evenings from 18 to 24, when 68.9 % watch TV. The assets are a 30-second brand film and a 15-second cut-down for frequency.
Within video YouTube gets 35 000 €: a non-skippable 15-second ad for recall and a 6-second bumper for frequency, weighted towards under-56s. Katsomo gets 15 000 € and Ruutu 10 000 €, in proportion to their reach. The same brand film runs in every channel, so people recognise the message wherever they see it.
Recall is measured, not assumed. A post-campaign study shows how many remembered the ad and in which channel.
Assumptions: audience 3.95 million (Media Insights 08/2026). Channel reach = contacts ÷ actual frequency ÷ audience, capped at the channel's three-week reach. TV at rate card, about 12–14 € per 1 000 contacts (MTV and Sanoma 2026), video at the price level achieved in NØRR3's campaigns, with a 25 % buffer for broadcaster streaming. Channels combined assuming random overlap, rounded to 5 pp. Negotiated TV prices increase reach. The estimate applies to campaigns outside October–December. In October–December prices are about 15 % higher, so the same budget reaches an estimated 75 %.
Myth: "Brand videos are no longer needed, now you need influencers and user-generated content"
The claim is partly true for one audience and falls apart for the population as a whole.
It is true that under-37s act on influencer advertising more often (45.1 %) than on TV advertising (33.2 %). TV reaches young women least of all (index 52). If your audience is women aged 18–36, creators belong in the plan.
Across the whole population the picture turns around:
- Influencer advertising gets 28.8 % to act, TV 38.0 %. Among over-55s, 11.9 % have acted on influencers and 40.1 % on TV. (NØRR3 Media Insights 08/2026, n = 2 022)
- Per euro, influencers hold their own, but they lack scale. In the IPA's data on 220 campaigns, the short-term ROI index for influencers was 99 and for TV 97, so about the same. Yet influencers drove 4.5 % of short-term sales and TV 32 %. (IPA Influencer Marketing Databank, 10/2025)
- Few creator ads build the brand. In Kantar's data on more than 15 000 branded creator posts, only 6 % achieved both high engagement and strong brand impact. (Kantar, The Creator Game Plan, 06/2026)
A brand video builds memory structures: what the brand looks and sounds like and which situation it belongs to. Influencers and user-generated content carry the same message to groups TV does not reach, and they work best when the recognisable brand shows up right at the start. You need both. The order is brand first, then spreading it.
What follows from this
- Choose channels by age group, not by media type. Under-37s are on YouTube, over-55s in front of the TV, and the middle group in both.
- Calculate reach among those open to advertising. Yle, Areena and Netflix do not sell ads, and on YouTube you deduct those who avoid ads.
- Keep TV for recall and video for reach. Together, 150 000 euros reaches an estimated four in five Finns.
FAQ
Do young people still watch TV?
They do, but less often. Among 18–36-year-olds, 46.5 % watch TV channels weekly and 16.7 % daily. Three years ago the figures were 60.3 % and 22.7 %.
Why is the survey's TV figure lower than Finnpanel's?
Media Insights asks which channels people follow. Finnpanel counts everyone who has watched for at least one minute. The methods differ, so the figures differ. The direction is the same.
Can we plan our campaign with this data?
Yes. We cut the figures to your audience by age, gender, region, income and household size, among others, and calculate how many of them are open to advertising.
Ask us about your audience
Tell us who you want to reach and we will show with numbers which split between TV and video works for you. Or let's update your audience profile together.
Get in touch and let's look at the numbers
Read also: Media research: how Finns use media in 2026 and how NØRR3 Media Insights works as part of media planning.
About the author
Antti Ujainen, Managing Director, NØRR3
A strategist who runs on client results, technology and good people. 20+ years in marketing and entrepreneurship.
Off the clock: beach volleyball, snowboarding and freeride snowmobiling. Cottage enthusiast, and a slightly bewildered member of a family of six.
Sources
- NØRR3 Media Insights 09/2023–08/2026, panel data Norstat, nationally representative ages 18–74 (latest wave 08/2026, n = 2 022)
- NØRR3 campaign bank, Norstat campaign studies 2023–2026 (37 studies)
- Finnpanel: Television viewing in Finland 2025, TV year event 4.2.2026, https://www.finnpanel.fi/lataukset/tv_vuosi_2026.pdf
- PHD Finland: ad recall by channel, 296 campaigns 2011–2021
- IPA: Influencer Marketing Databank, 8.10.2025, https://ipa.co.uk/news/influencer-marketing/
- Kantar: The Creator Game Plan, 25.6.2026, https://www.kantar.com/de/inspiration/advertising-media/the-creator-game-plan

Share
LinkedIn